How to create User Flow Diagrams – Clutter-Free
When you create and maintain apps, websites and digital services, the User Flow Diagram is indispensable. And, you don't need the clutter.

What is a User Flow Diagram?
You just entered the Wild West of terminology. Beside User Flow Diagram there are loads of buzzwords with partially overlapping meaning: UX Flow Charts, Task Flows, Wire Flows, Flow Charts, UI Flows, User Journey – to mention just a few.
uxbeginner.com makes a decent attempt to sort things out. Here is an article that also tries to sort things out: UX Flows, and Why They’re So Confusing. I'll leave that discussion to others and focus on the term User Flow Diagram.
Most people in the digital industry use User Flow Diagrams to follow the user step by step. The most concise definition I have found is:
User flow is the steps a user takes to accomplish a task on your site/app/service. It includes all the different pages and touch points that are part of that interaction. If your site/app/service was a city, there would be roads running through it. These roads are the user flow that visitors follow.
– partially cited from optinmonster.com
In this article we're talking about User Flows in apps, websites and digital services typically in a continuous session. We can talk about User Flows in a wider context, across multiple channels and over a longer time span. We will cover that in a different article.
Distinct from sitemaps which emphazise on the structure of an app/site/service, typically visualizing the hierarchy of pages, a User Flow Diagram visualizes the steps it takes for the user to accomplish a specific task, e.g. "Order ticket", "Activate account".
User Flow Diagrams enable us to see the world from the user's perspective, while the elevated goal is to optimize the user's ability to accomplish a task with the least amount of friction.
Why User Flow Diagrams?
It sure takes some time and effort to master User Flow Diagrams. So, what are the upsides?
It provides a map
If you were the architect hired to build a city, a natural starting point would be to create a map. And I guess the first thing you would start to build would be the main street. This metaphor isn't that far off.
With a map visualizing how your citizens will flow, you can prioritize what to start with, where to set up temporary shortcuts and even which dead-ends you can deal with later. Just like you would when creating a site/app/service.
It makes complexity manageable
A visual representation of a complex case makes it easier to reason about and easier to have a conversation about. User Flow Diagrams done right will also uncover edge cases that are otherwise often hard to find. It can reveal inconsistencies early in the project – before implementing them.
It helps non-tech team members to understand what's going on
Since we are taking the user's perspective when working with User Flow Diagrams, it is primarily a non-tech tool. The end-product is supposed to be consumed by ordinary people, so a User Flow Diagram should be understood by non-tech team members. This makes it a lot easier for everyone to contribute.
The critics
The critics says that User Flow Diagrams require more time to build than most of us feel we can take away from our meetings and other important tasks (Why User Flow Diagrams Are Worth Your Time). Since our most valuable resource is time, this question is legitimate.
Sure, User Flow Diagrams take time, but with the right tools and a little bit of practice I believe that you soon will see that the scales tip in favour of User Flow Diagrams.
Other critics says that diagrams become instantly outdated as screens change. Ryan at Basecamp states that: all diagrams are destined for the garbage (A shorthand for designing UI flows).
Sure, but the answer is the same. With the right tools I believe that you will see that keeping your User Flow Diagram up to date is easy enough and worth the effort.
What is a good User Flow Diagram?
Here are some best practices:
- Strive to add as little complexity as possible. This is not where you should show off. Find a different arena for that 😉.
- Use space and keep it visual – not text heavy.
- Try to hide less important details. Keep comments and additional info outside with references to the diagram.
- Use a limited number of visual components to express logic. Different frameworks and tools offer different sets of visual components. Use them wisely.
- Strive to use intuitive visual components. Ideally, it should be possible to read the User Flow Diagram without any prerequisites.
Tools
You have a lot of tools to choose between.
Microsoft Visio is widely used. A great alternative is Lucidcharts. Besides plenty of other similar tools, these tools are more or less based on graphical notations like UML and BPMN.
Designers who master applications like InDesign, Sketch or Figma usually prefer to create User Flow Diagrams directly in these applications. Templates with structure and visual components gives you a flying start. Here are examples of Figma templates.
Here are some other options:
- Mind mapping tools like XMind are effective and intuitive to use.
- Rumors say that the drawing tool in Google Docs does a decent job.
- Don't forget pen and paper or whiteboard and marker. It offers unbeatable flexibility while you make the User Flow Diagram, but it is hard to keep up to date while your project unfolds.
Our take
With Aiava we take a radically different approach to making User Flow Diagrams. We have created a concept – and a tool that enables you to just write what's happening and Aiava will do the drawing.
The concept
- Think of your app/site/service as a universe. Your universe has a set of actors: the customer/user, the app itself, servers, Support Dept. etc.
- The actors communicate with each other through channels: interaction on a screen, email, by phone etc.
- When the actors use the channels, we add content: a screenshot, content in the email, the phone script
- We use the actors and channels to build a journey (or diagram if you will). The journey visualizes every step the users (and other actors) take. Every step in the journey is a task, making it clear that there is an actor trying to achieve a goal.
Here is an example of a task:

When we add channel content, we can view the task like this:

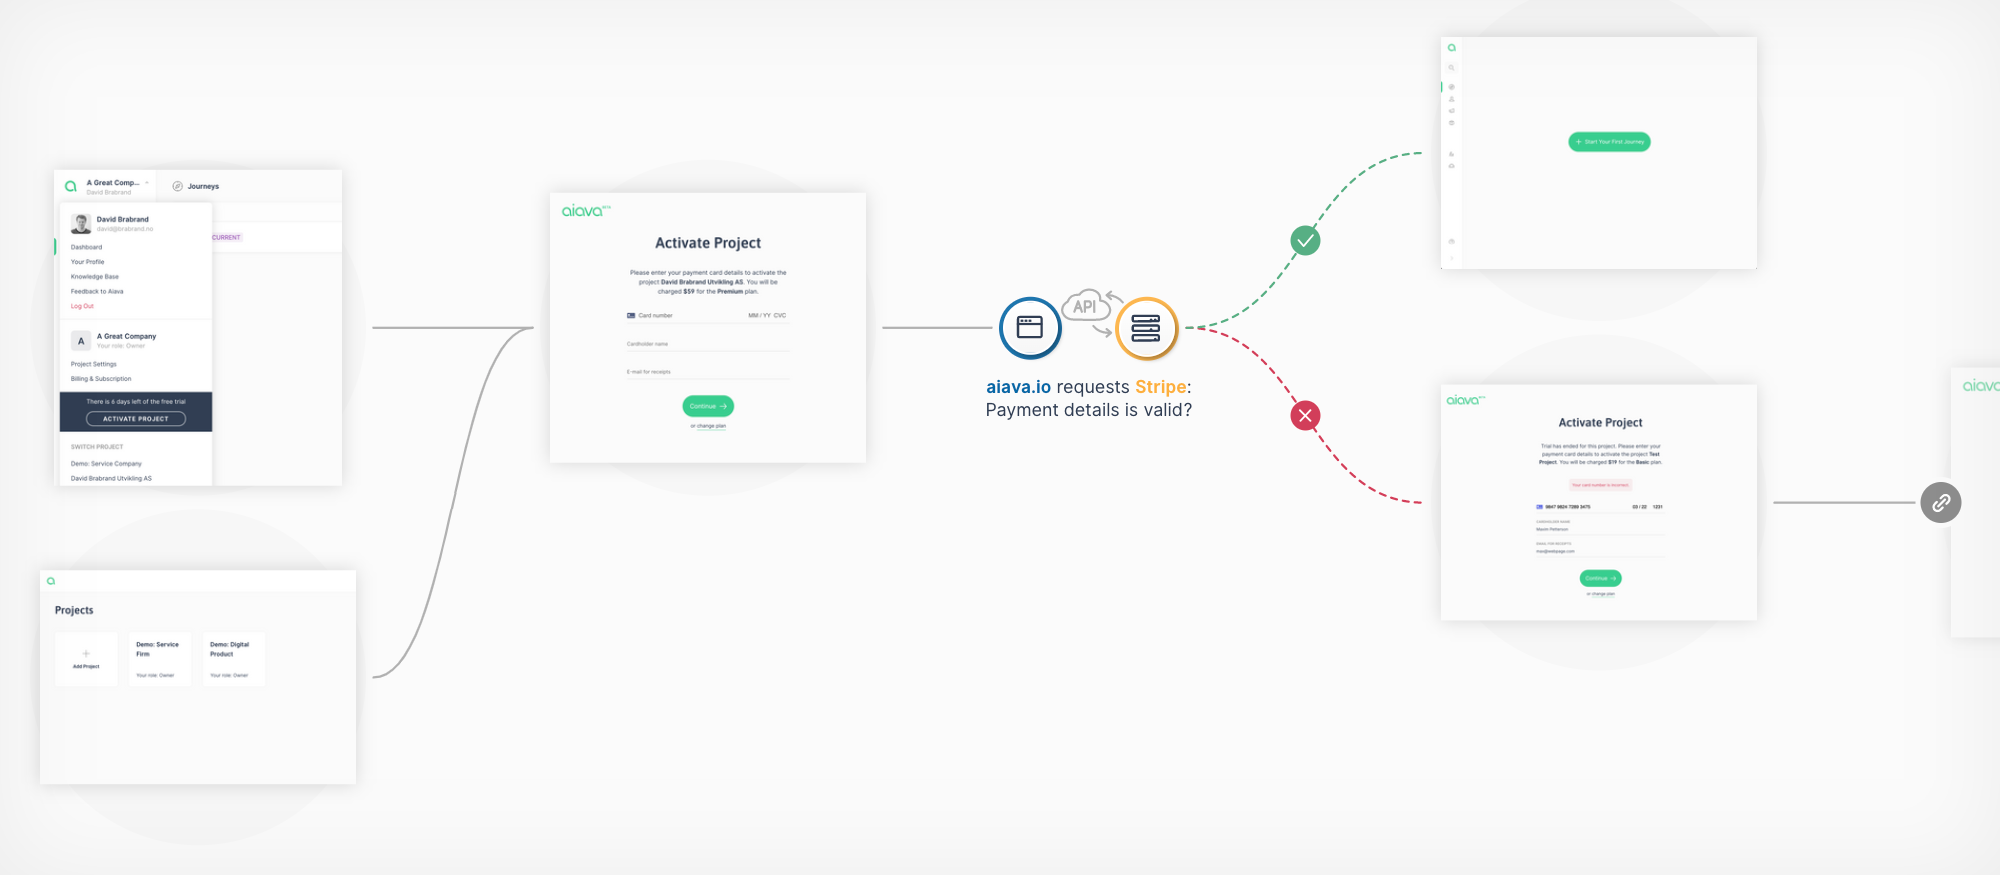
When we connect the different tasks, we can add information on the links; what kind of conditions must be present for the next task to happen. It looks like this:

That's it! But why do we do it like this?
Intuitive
We strive to keep the numbers of visual components to a bare minimum and as intuitive as possible. We don't use diamonds, ovals, rectangles and what not – just tasks. Actors communicating, deciding and performing actions.
The flow is always from left → right. This makes things clearer:
- It's easier to follow when you know the direction.
- The entrances are easy to find: they are at the start.
- We don't need the arrow head (less is more).
Sometimes users do go backwards. For example, maybe the payment information is invalid, and the user has to try again. We visualize this with what we call a cross-link – a dim version of the task with a button. Click the button and you will jump to the task.

Efficient
You can build comprehensive User Flow Diagrams almost without leaving the keyboard. As you write the "story", you mention the actors and channels. Aiava will draw as you type and automatically create the layout – you don't have to tweak endlessly to make it look good.
Adding screenshots, mockups, wireframes is simply drag 'n' drop into the map.
Loading
Connected
Since you are mentioning actors and channels while you create the journey, everything is connected. Besides, you can connect the journeys; when you see that there is more happening beneath the surface, you can attach another journey to the task. A journey within the journey. It looks like this:

A map evolving with the project
Either you are a one-man band, doing it all by yourself, or you are collaborating in a team, your project is going through different phases. A project typically evolves from an idea or concept and then copywriters, designers, interaction designers and programmers add flesh to the bones. Aiava is built to grow with the project.
To start with, for example the project manager can sketch out the skeleton. This is useful to kickstart the conversation and get everyone on the same side of the table.

The copywriters add text:

The interaction designers do their magic:

The designers and illustrators add sketches and designs:

The engineers can use the User Flow Diagram as documentation when they do the heavy lifting. Besides, they can enrich the map with details like:
- what kind of services/APIs our app/site/service communicates with
- business logic
- what happens behind the scene
We end up with a User Flow Diagram like this:

Aiava is not just a User Flow Diagram tool. With Aiava we can map out the bigger journey as well – across channels and through the whole "life of a customer". This is why we call it a tool for Customer Journey Mapping.